IC/ASIC Functional Verification Trend Report - 2020
This report presents the results from the 2020 Wilson Research Group
functional verification study, which were focused on the integrated circuit
(IC) and application specific integrated circuit (ASIC) market segments. The
findings from this study provide invaluable insight into the state of today’s
IC/ASIC market in terms of both design and verification trends.

-
Introduction
This report presents integrated circuit (IC) and application specific integrated circuit (ASIC) functional verification trends based on the 2020 Wilson Research Group functional verification study, which is a continuation of a series of industry studies that have occurred over the past eighteen years.1,2,3,4,5,6 For our 2020 study, we have separated FPGA from IC/ASIC functional verification trends, and this report focuses on the latter.
A. The Global IC/ASIC Semiconductor Market
The 2019 global semiconductor market was valued at $385.4 billion after experiencing a 15 percent decline due to a 32 percent drop in the memory IC market, which is expected to recover in 2021. The IC/ASIC portion of the semiconductor market is valued at about $186.6 billion.7,8 The IC/ASIC semiconductor market is expected to reach a value of $233.4 billion by 2024, growing at a compounded annual growth rate (CAGR) of 4.6 percent during this forecast period. While COVID-19 has had a negative impact in 2020 on a number of market segments (e.g., consumer and automotive), other market segments (e.g., data center computing, networking, storage, and communication) are experiencing positive growth required to support today’s growing work-from-home (WFH) environment.
B. Study Background
The study results presented in this report are a continuation of a series of industry studies on functional verification. This series includes the previously published 2012, 2014, 2016, and 2018 Wilson Research Group functional verification study.3,4,5,6 Each of these studies was modeled after the 2002 and 2004 Collett International Research, Inc. studies1, 2 and focus on the IC/ASIC market.
For the purpose of our study, a randomized sampling frame was constructed from multiple acquired industry lists. This enabled us to cover all regions of the world and all relevant electronics industry market segments. It is important to note that we did not include our own account team’s customer list in the sampling frame. This was done in a deliberate attempt to prevent vendor bias
in the final results. While we architected the study in terms of questions and then compiled and analyzed the final results, we commissioned Wilson Research Group to execute our study. After data cleaning the results to remove inconsistent, incomplete, or random responses, the final sample size consisted of 1492 eligible participants (i.e., n=1492).Figure 1 compares the percentage of 2020 and 2018 study participants (i.e., design projects) by targeted implementation for both IC/ASIC and FPGA projects.
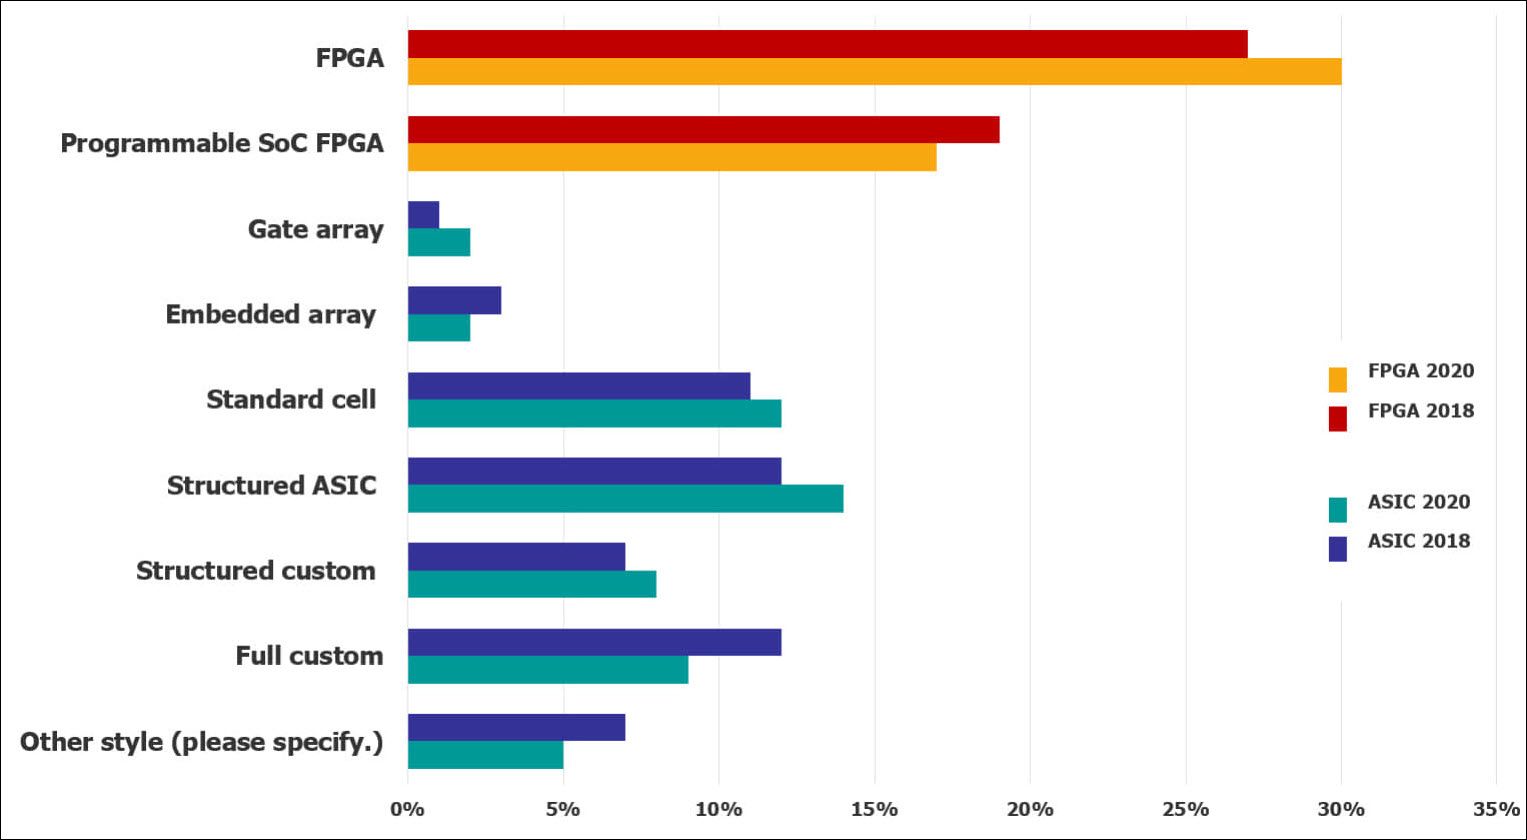
Figure 1: Study participants by targeted implementation
C. Study Confidence Interval
Since all survey-based studies are subject to sampling errors, we attempt to quantify this error in probabilistic terms by calculating a confidence interval. For our study, we determined the overall margin of error to be ±3 percent using a 95 percent confidence interval. In other words, this confidence interval tells us that if we were to take repeated samples from a population, 95 percent of the samples would fall inside our margin of error ±3 percent, and only 5 percent of the samples would fall outside.
-
Download Paper
-
Related Resources
-

FPGA Functional Verification Trend Report - 2020
This report presents the results from the 2020 Wilson Research Group
Functional Verification Study focused on the Field-Programmable Gate
Array (FPGA) segment. The findings from this study provide invaluable
insight into the state of today’s FPGA market in terms of both design and
verification trends.
-