Advanced Debug Techniques
In this track, you will learn how the Visualizer Debug Environment can debug and verify your complex SoCs and FPGAs.
-
Sessions
-
Prevent Performance Problems with Prompt RTL Profiling
Code profiling is a technique to identify performance issues in software code, helping developers understand how code is being executed, and identifying inefficient “hot spots” that are disproportionately impacting the code’s wall-clock run-time and memory usage. -
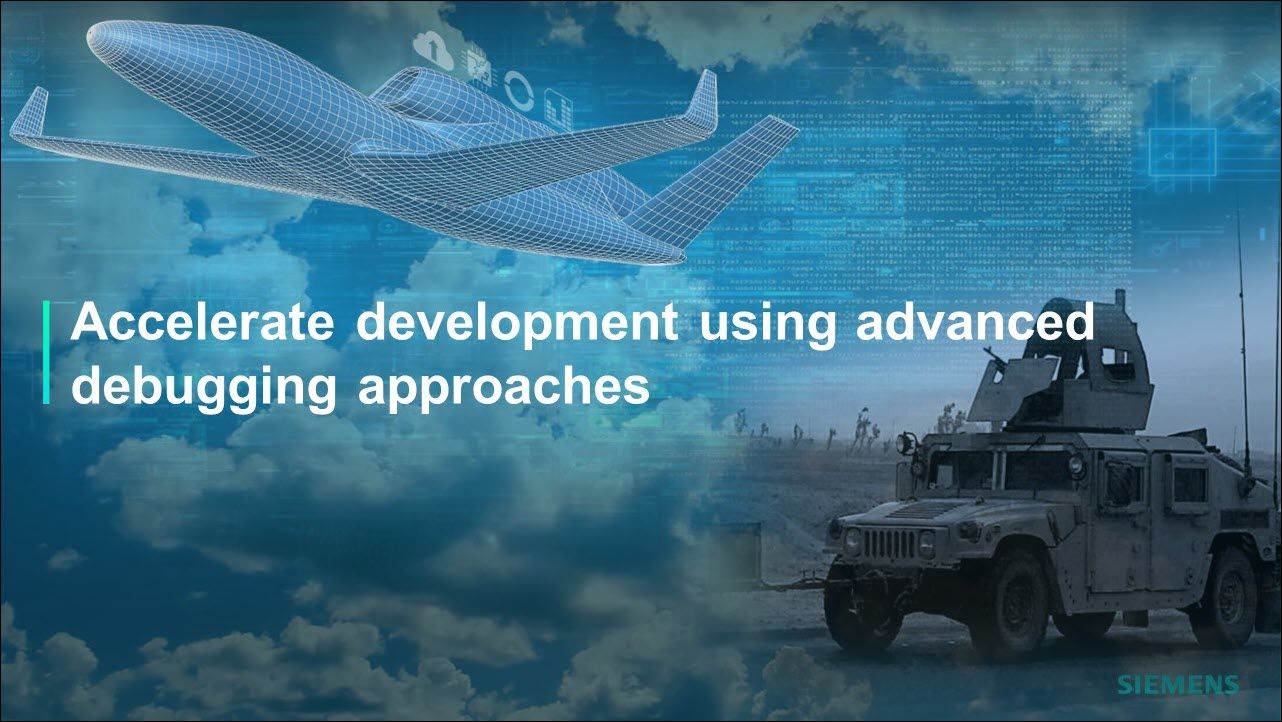
Accelerate Development Using Advanced Debugging Approaches
In this session, you will learn how Visualizer Debug Environment provides a high-performance, high-capacity, tightly integrated debug environment for Simulation and Emulation. -

I Didn’t Know Visualizer Could Do That
In this session, you will learn about Visualizer's powerful features that improve debug productivity for System Verilog/UVM, transaction-level, RTL, gate-level and low-power design and verification. -
Better UVM Debug with Visualizer
In this session you will learn UVM Debug tips and tricks in both Post simulation and Live simulation. -

Introduction to Visualizer for Verilog Users
Complex testing and methodology with complex silicon require powerful but simple to use debug solutions. The Visualizer Debug Environment provides a common debug solution for simulation, emulation and other engines, including Verilog, VHDL, UVM, SystemC, C/C++, Assertions and Coverage.This session will introduce the Visualizer Debug Environment for Verilog and UVM. -
Introduction to Visualizer for VHDL Users
Complex testing and methodology with complex silicon require powerful but simple to use debug solutions. The Visualizer Debug Environment provides a common debug solution for simulation, emulation and other engines, including Verilog, VHDL, UVM, SystemC, C/C++, Assertions and Coverage.This session will introduce the Visualizer Debug Environment for VHDL and UVM. -
Interactive Debug Techniques for UVM, SystemVerilog and RTL using Visualizer
Debug is one of the most time-consuming tasks verification engineers face in the design and verification of FPGAs, IPs and SoCs. Visualizer provides an advanced debug environment that includes many tools to help with both post-simulation and live-simulation debug.This session will cover different techniques for debugging SystemVerilog UVM testbench and RTL source code while running a live simulation. -
Visualizer Coverage: Debug and Visualize All Your Coverage
In this session, you will learn coverage techniques including; how to use testplan tracker in Visualizer to analyze the testplan, finding uncovered items using code and functional coverage windows and fixing them using coverage debugging mode. -
Embedded Software Debug Using Codelink and Visualizer
In this session, you will learn how you can save time and improve your embedded software debug techniques by utilizing tips and tricks in Post simulation. -
Verification and Debug: Old School Meets New School
You will learn how to use the best of old and new school debug techniques to find problems faster and to better answer “am I done yet”. -
Transaction Recording & Debug with Questa & Visualizer
This session will explore the Transaction Recording (TR) and debug capabilities of Questa Sim and how they can be applied in the context of a UVM testbench. -
Functional Debug: Verification and Beyond
In this session, we will explore an alternative approach to SoC development, analysis, debug and bring up. We will describe a different approach, in which debug and performance tuning is considered from the outset, by including within the SoC a light but independent infrastructure dedicated to bringing debug visibility across the entire SoC – an approach which is independent of CPU architecture. -
Productive Low Power Debug Across All Engines and Flows
In this session, we will answer the top nine questions asked for debugging low power in your design. -
Are You Trapped in an Unfamiliar, Large SystemVerilog UVM Testbench?
This session will describe useful debug techniques for debugging a UVM testbench with 8 to 10 agents, and many stimulus generators, checkers and exception handlers running in parallel. -
Enterprise Debug for Simulation and Formal
In this session, you will learn more about common debug challenges and modern debug solutions. -

Evolution of Debug
In this session, Gordon Allan takes a critical look at the past, present and future challenges for debug, exploring real world situations drawn from years of experience in SoC design and verification, and describing leading-edge techniques and compelling solutions.
-
-
Overview
Complex testing and methodology with complex silicon requires powerful but simple to use debug solutions. Debug Expert, Rich Edelman will explore better UVM debugging, debug for Verilog and debug for VHDL including automation for driver tracing and X-tracing, post-simulation and live-simulation debug, class based debug and transaction debug.
The Visualizer Debug Environment is a powerful framework for debug and verification for simulation, emulation, formal, CDC, lint, analog and other technologies. Assertion debug and coverage analysis are available, along with traditional waveform debug, source code debug with the capacity and performance for even large gate-level designs.
In these sessions you will learn how the Visualizer Debug Environment can debug and verify your complex SoCs and FPGAs.
-
Forum Discussion - Debug
-
Is there a way to get around a generate for loop allowing only one genvar variable
Sep 27, 2025 SystemVerilog